Measured at the BG1SB station Ā· Profile 2026-09-27 Ā· Full learn-library calibration 2026-09-28 Ā· Fully reproducible

Every decibel of this antenna
comes with a measurement on file

A 21.9 m EFHW sloper strung between a 4th-floor window sill and the waist of a tree, fed through a Fair-Rite 2643251002 (2:14 turns, 49:1) unun and an ATR-1000 auto antenna tuner. This page is its complete measured profile: fundamental resonance measured at 6.50 MHz, a raw-SWR panorama across all seven bands, an evidence-based verdict on the 49:1 ratio, radiation cross-validated by 7,000 km-class DX spots on PSK Reporter, and a minute-by-minute record of tuner parameter drift through an entire rainfall. All raw data (JSON) and the re-computation scripts live in the repository.

The device under test and the measurement chain

Before reading the numbers, meet the antenna and the ruler. The measurement chain itself was cross-validated: every isolated anomaly was re-measured and adjudicated, and all auto-tuning paths were physically isolated during sweeps.

ItemParameterNotes
Antenna type EFHW sloper Feedpoint on a 4th-floor window sill (~10–12 m high), sloping down ~40° west of south (azimuth ā‰ˆ220°), far end tied at the waist of a 3 m-high tree
Radiator length ā‰ˆ 21.5–21.9 m Back-derived from f1=6.50 MHz (velocity factor 0.93–0.95); consistent with the eyeball estimate of "about 21 m"
Unun Fair-Rite 2643251002, 2:14 turns (49:1) Material 43, primary magnetising inductance L_m ā‰ˆ 4.3 µH
ATU ATR-1000 (L-network, 0.1 µH / 10 pF quantisation) With LC learn library; measurements taken in bypass (L=0/C=0) for raw SWR
Radio Icom IC-M710 (MRRC remote system) tune carrier keyed point by point; meter readings median-filtered
Method In-house sweep engine antenna_sweep.py 10 kHz steps, 0.4 s settle + 1.2–2.5 s sampling; learn library and SWR auto-tune guard disabled before each sweep, zero contamination verified after
Data cleaning Dropout-run removal + 100% re-measurement verification Isolated SWR=1.00 spikes are dropouts in the meter's reflected channel; all 36 removed points were re-measured with long dwell, 36/36 confirmed false readings (e.g. 7130 kHz: 1.00→3.58)
Data discipline. Every SWR value on this page is a measured meter reading with the ATR-1000 in bypass, not a simulation. Every "extrapolation" paragraph is explicitly labelled. Lessons learned during measurement are recorded honestly too: the first re-measurement was contaminated by the auto-tune guard of another system on the same radio (mrrc_modern) — it triggered a tune while we were sweeping, and subsequent points showed falsely low SWR with L/C engaged. That dataset was voided and re-measured; the lesson is now baked into the operating procedure.

f1 = 6.50 MHz: a textbook V-curve

Dense sweep of 102 points over 6.0–7.3 MHz in 10 kHz steps. The SWR=1.00 plateau spans 160 kHz, with symmetric, smooth rises on both flanks — no simulation could be any cleaner.
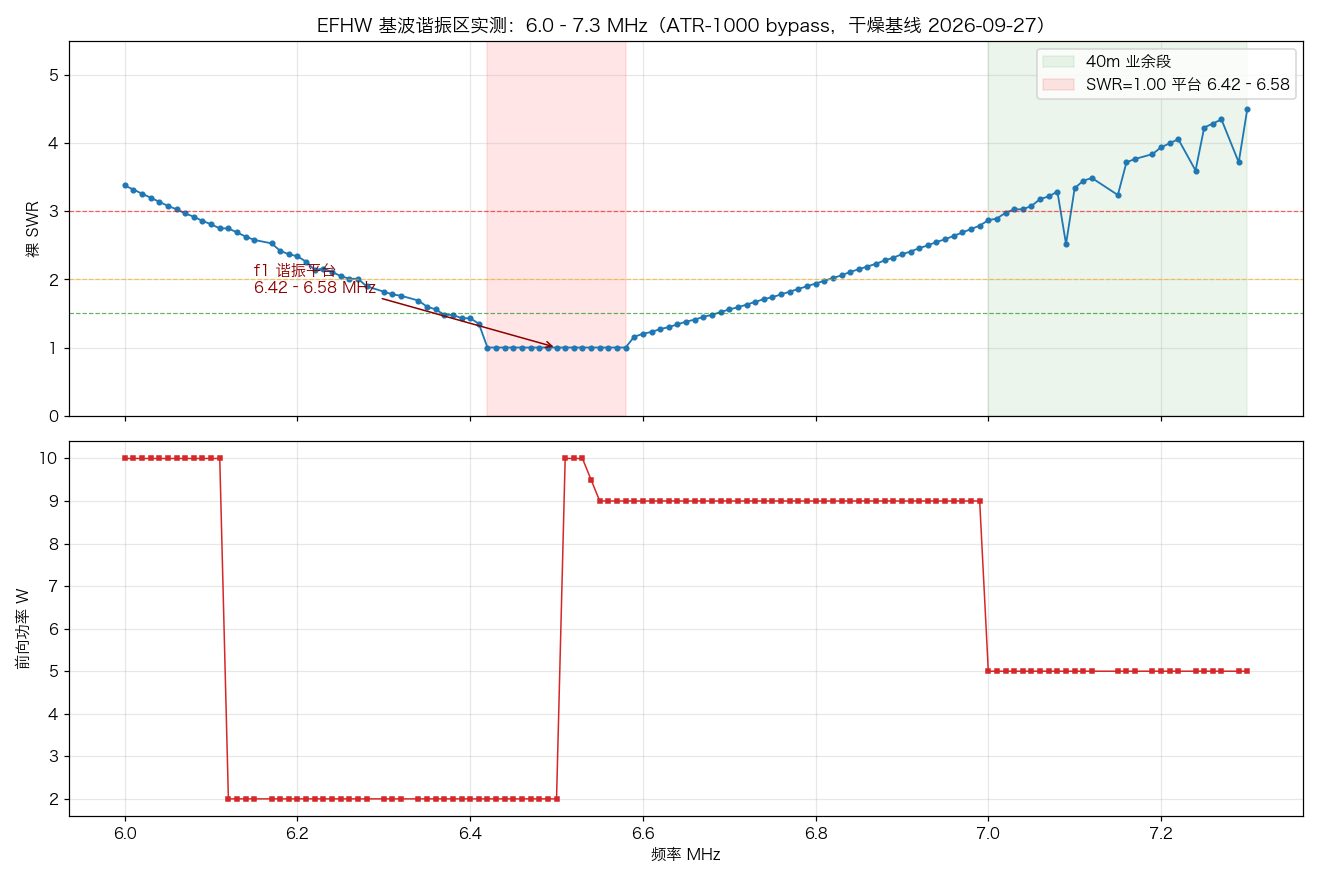
Measured EFHW fundamental resonance region 6.0-7.3MHz: SWR V-curve and forward power corroborate each other
Top: raw SWR (red band = SWR 1.00 plateau 6.42–6.58 MHz, green band = the 40 m amateur segment). Bottom: forward power — the radio puts out 9–10 W on the resonance plateau and falls to 5 W/2 W in the mismatch regions; the ALC back-off curve mirrors the SWR curve, and the two independent measurements corroborate each other.
HarmonicMeasured positionRelative to integer multipleEvidence
f1 (fundamental) 6.50 MHz (plateau 6.42–6.58) 1.00 Directly measured flat bottom of the V
2f ā‰ˆ 13.9–14.0 MHz 2.15 20 m segment floor lowest at 14.000 (1.45) and still falling
3f ā‰ˆ 21.3 MHz 3.28 Plateau at 21.23–21.42 (SWR 1.00) within the 15 m band
4f ā‰ˆ 28.5 MHz 4.38 Deepest dip at 28.48 (1.66) within the 10 m band
The harmonic ratios drifting upward step by step (1 : 2.15 : 3.28 : 4.38) are the fingerprint of EFHW end effect: the wire-end distributed capacitance shortens the electrical length most at the fundamental, and its influence shrinks with frequency, so each higher resonance lands progressively above the ideal integer multiple.

This wire length is a happy accident: f1 landing at 6.50 pushes the entire 40 m segment onto the rising right flank of the resonance (raw SWR is already 2.87 at 7.0 MHz, so the whole band demands the tuner); but it also places 2f at the bottom edge of 20 m and 3f dead centre of 15 m — the current length is a gift for the high bands and a price for 40 m. The f1 region has Q ā‰ˆ 12 (SWR≤2 bandwidth 530 kHz), far wider than the textbook "needle" — ground-proximity loss and feedline participation lower the Q, and in exchange you get the wide plateau on 15 m.
The true colours of every band, tuner in bypass

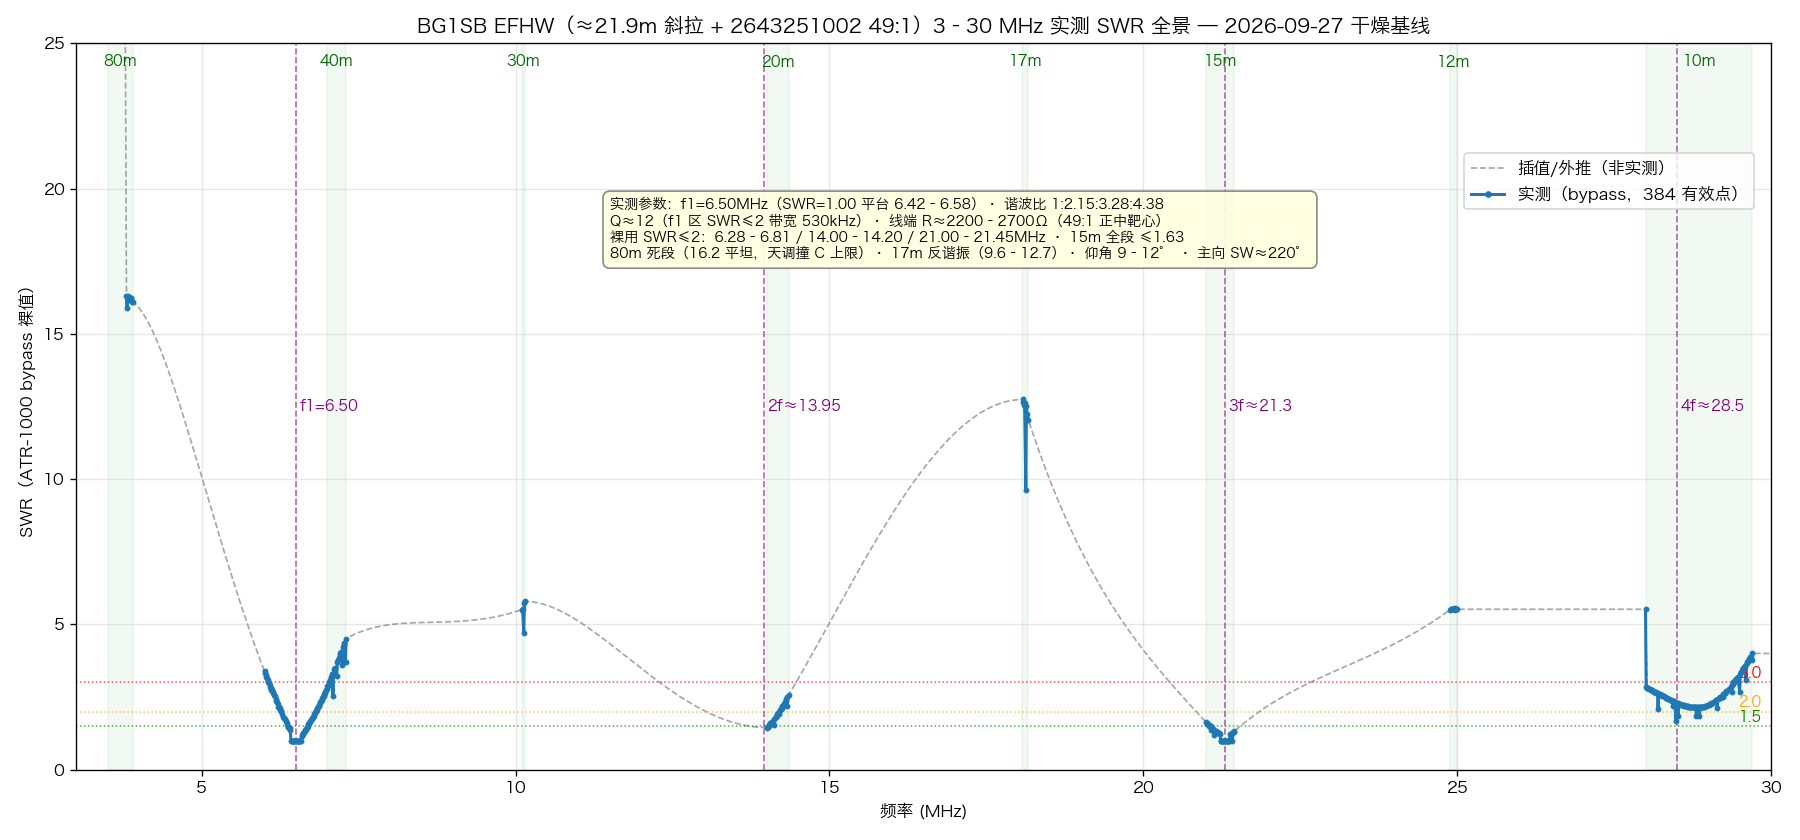
All seven amateur bands from 7–29.7 MHz, 312 points, dropouts cleaned. This table answers: which bands work raw, which need the tuner, and which to avoid.

Measured SWR panorama 3-30MHz: measured clusters as solid lines, interpolation dashed, resonance markers
3–30 MHz panorama: bold solid lines + dots are measured clusters (384 valid points); grey dashed lines are interpolations between measurement clusters / extrapolation below 3.8 MHz (not measured); purple dashed markers are the four measured resonance points.
BandMedian raw SWRLowest pointShapeUsable without tuning
80m 3.8–3.916.2 16.09Dead flat āŒ Structurally dead band; no tuner can save it
40m 7.0–7.33.47 2.87 @7.00Monotonic rising flank āŒ Tuner mandatory across the band (post-tune SWRā‰ˆ1.0–1.2)
30m 10.15.54 4.70FlatāŒ
20m 14.0–14.351.90 1.45 @14.00Gentle rise āš ļø Lower half (≤14.20) usable raw
17m 18.07–18.1712.54 9.64Anti-resonance plateau āŒ Worst band on the wire; even the tuner struggles
15m 21.0–21.451.25 1.00 plateauGentle fall into plateau āœ… Best band; no tuning needed anywhere
12m 24.89–24.995.53 5.51FlatāŒ
10m 28.0–29.72.48 1.66 @28.48Shallow dip āš ļø Middle section (28.2–29.0) usable raw
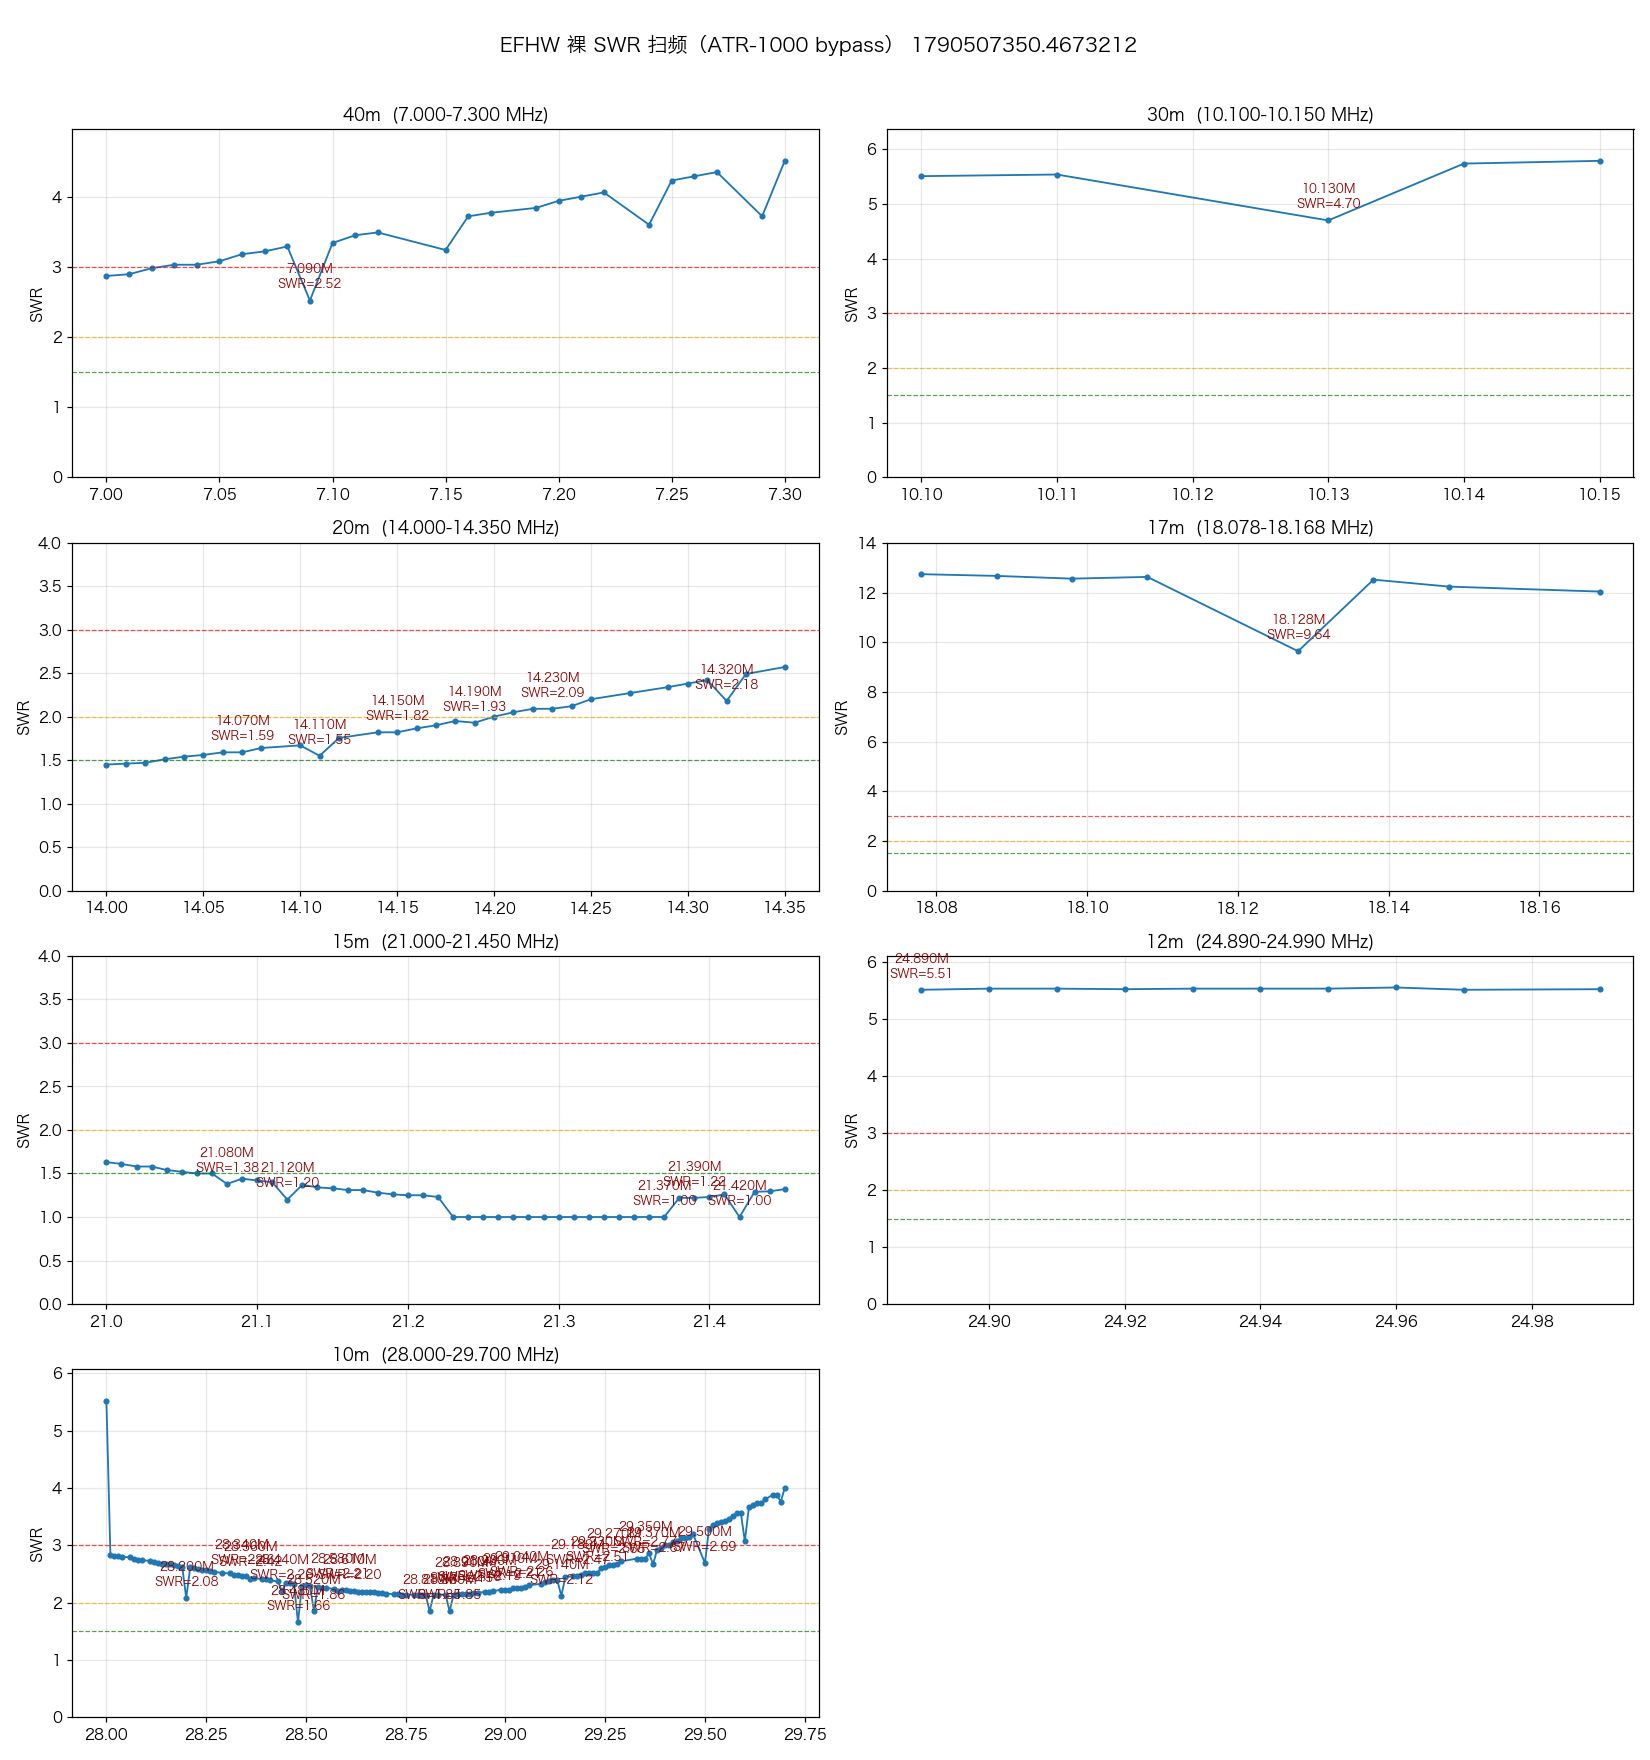
Measured raw SWR curves for the seven amateur bands
Seven-band panorama (bypass, dropouts removed). Green/orange/red dashed lines = SWR 1.5/2.0/3.0.
Summary of raw-usable ranges (SWR≤2, measured): 6.28–6.81 MHz, 14.00–14.20 MHz, 21.00–21.45 MHz (all of 15 m). SWR≤3: plus 6.07–7.02, all of 20 m, 28.01–29.41. The whole 15 m band at SWR≤1.63 is this antenna's headline figure.

The 49 vs 64 debate, settled by one bypass measurement

"49:1 or 64:1" is called "an argument about measurements" on the research site. This page delivers the measured verdict for this antenna.

Criterion: on the f1 resonance plateau, with the tuner in bypass (L=0/C=0), measured SWR = 1.00. That means the "unun + feedline" chain transforms the wire-end impedance to right around 50 Ī© at resonance — for this antenna 49:1 is a bulls-eye ratio, wire-end resonance resistance ā‰ˆ 2200–2700 Ī©, close to the theoretical 2450 Ī© (50 Ɨ 49). Swapping to 64:1 (target 3200 Ī©) would instead pull the rig-end impedance down into the 35–40 Ī© region, leaving an SWRā‰ˆ1.3 residual floor at resonance.

Power design value: at 100 W the feedpoint voltage V=√(PĀ·R) ā‰ˆ 495 Vrms / 700 V peak. The unun's secondary insulation and the inter-turn and first-two-turns insulation must be designed for ≄700 V peak — consistent with the warning in the baluns topic page.

Seven days of raw PSK Reporter data: where it actually points

165 FT8 spots over 7 days from the StarRocks database (raw data behind the radio.vlsc.net:5000/antenna dashboard), cross-tabulated by distance, azimuth quadrant and time of day.

DimensionMeasured resultInterpretation
Typical take-off angle 9–12° (dashboard hop/elevation analysis) Mid-to-low angles, better than a typical low dipole — thanks to the 4th-floor feedpoint height
Main working region 40 m night-time single-hop 500–2000 km, mean TX SNR -0.4 dB Japan/Korea, Northeast and East China circle; radiation efficiency in the near region is completely normal
Strongest azimuth 225–270° (west-southwest), mean RX -4.9 dB, strongest overall Exactly the sloper's downhill direction (ā‰ˆ220°) — front-to-back toward the low end of the wire matches theory
TX/RX asymmetry TX means -3.5/-3.2 dB on 40 m/15 m, 6–8 dB stronger than RX (-11.1 dB) The classic combination of respectable transmit efficiency plus elevated urban local receive noise
DX highlight Copied by ZL1RPC (New Zealand, 10,412 km) at -4 dB during heavy rain on 9/26 Rain detuning was rescued by the tuner's automatic re-learning (auto-tune triggered at 20:04) — genuine low-angle DX capability
Time-of-day pattern All 40 m RX concentrates in 00–06 h (Beijing night), peaking 02–04 Under daytime D-layer absorption, a low sloper receives virtually no 40 m skywave

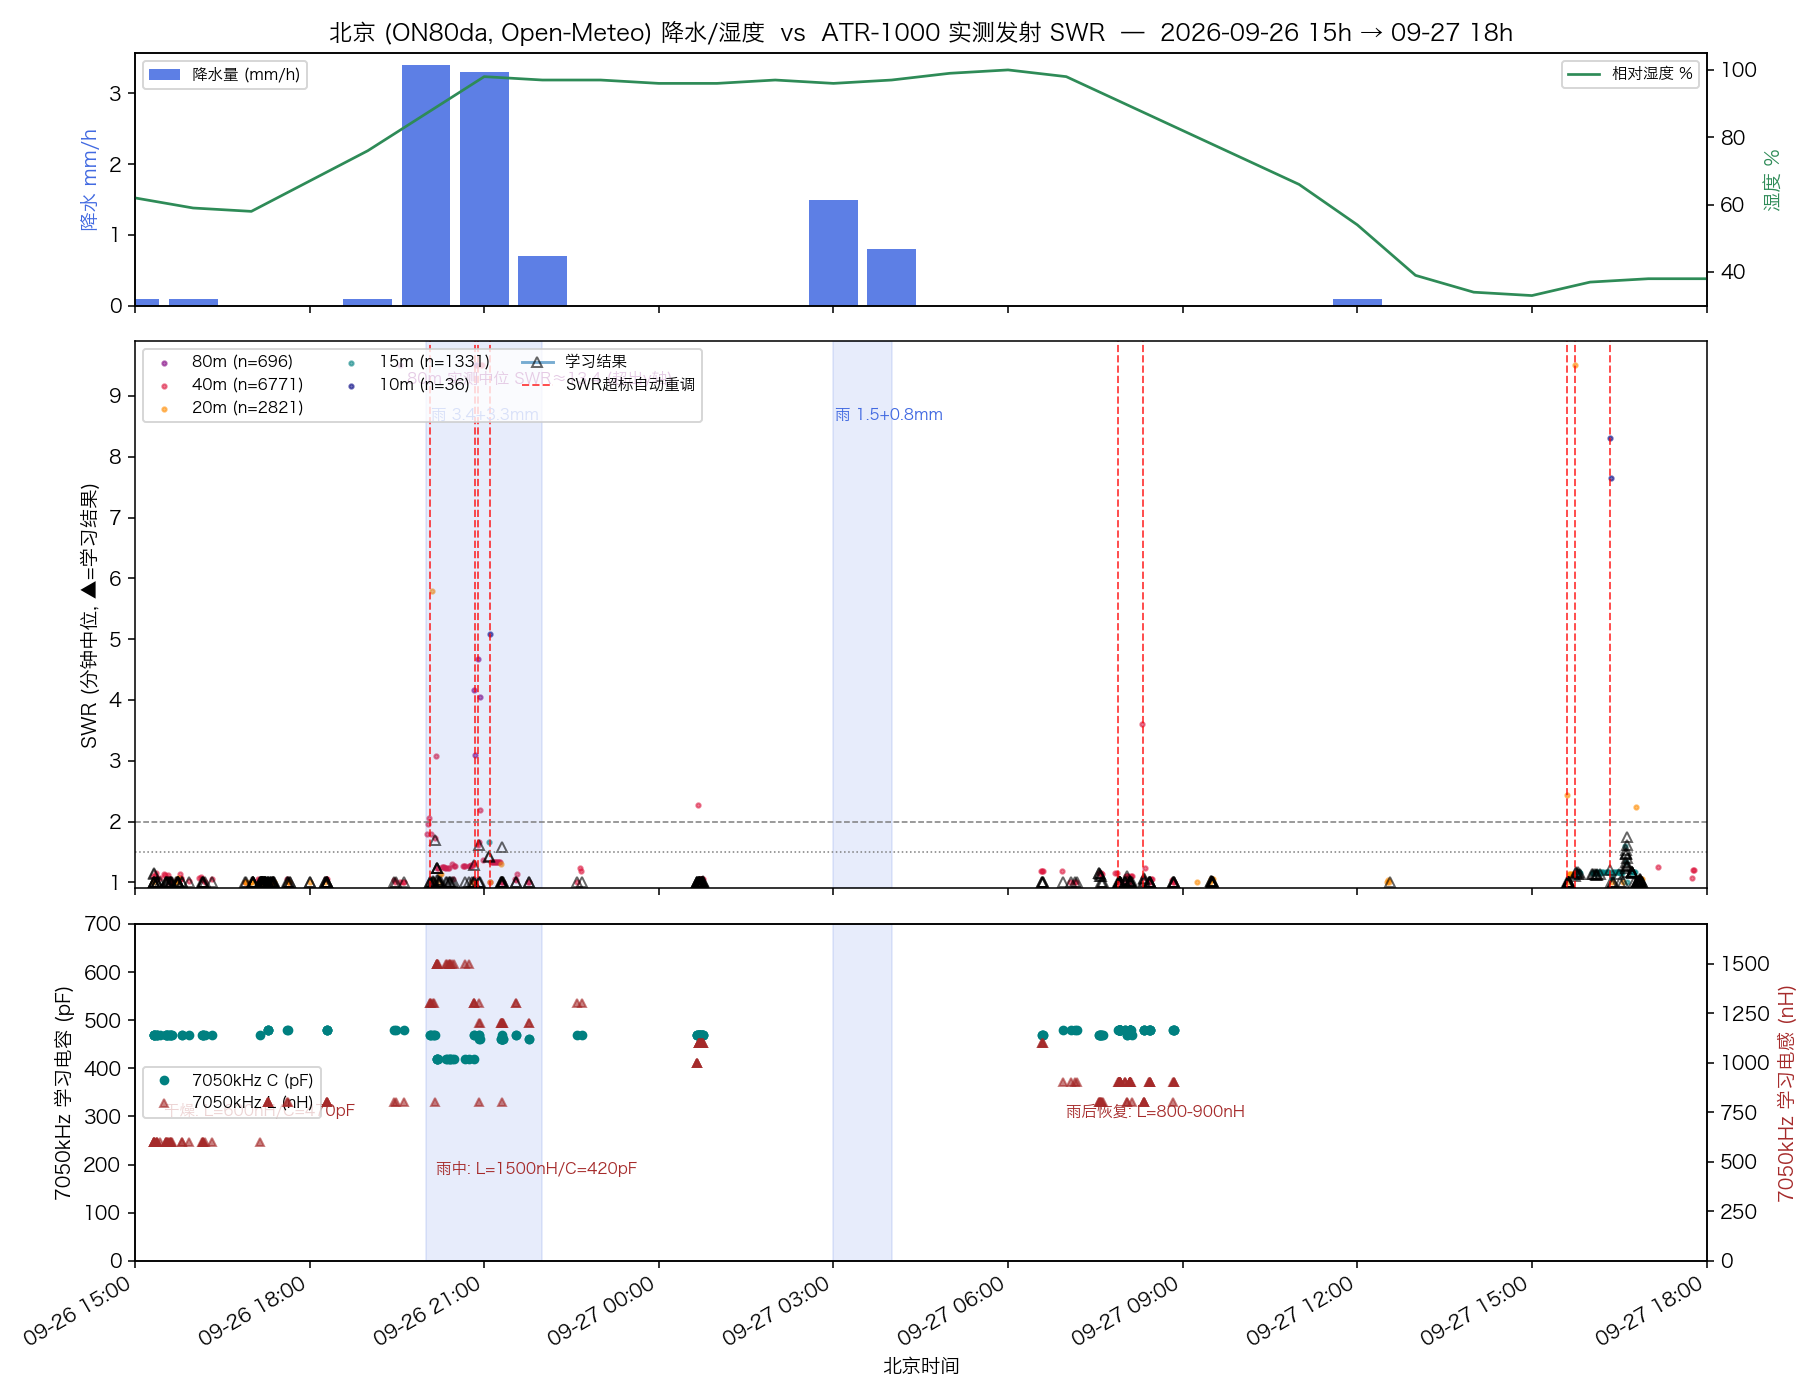
How one rainfall moved this antenna's resonance

Minute-by-minute cross of tuner learn parameters against Beijing's hourly precipitation through one complete rainfall on 9/26–9/27. A rare quantitative record of EFHW rain detuning.

Cross timeline of the rainfall and SWR/tuner parameter drift
PeriodWeatherLearn parameters at 7050 kHzStatus
Before rain (dry)RH climbingLC L=0.6–0.8 µH / C=480 pFBaseline
20:00Rain begins (3.4 mm/h) SWR drifts to 1.77 at 20:01; auto re-tune at 20:04Detuning occurs
Heavy rainRainfall peak L=1.5 µH / C=420 pFSeries-L demand Ɨ2.5
Rain tapering offRH 94–98%L=1.2–1.3 µHPartial recovery
Late night after rainDrying outL=1.0–1.1 µH / C=470 pFContinued recovery
Quantitative reading: the series-L demand at 7.05 MHz rose from 0.6 → 1.5 µH, i.e. the antenna-side reactance shifted in the capacitive direction by Ī”X ā‰ˆ ω·ΔL ā‰ˆ +40 Ī©. The mechanism is textbook: rain raises the wire-to-ground distributed capacitance and adds dielectric loss → electrical length increases → resonance moves down (estimated 40–60 kHz) → the antenna looks more capacitive at a fixed frequency → more series inductance is needed to compensate. The far end tied at a 3 m tree waist amplifies this effect — wet bark is a semiconductor, effectively paralleling a weather-dependent R-C across the wire end. Operations implication: after rain, run one 2-minute single-band sweep on your working bands and compare against the dry baseline to quantify the drift.

Learn library: measured anchors + fitted fill + full-library calibration on 9-28

Current state of the ATR-1000 learn library. Measured anchors take priority; fitted entries are tagged and get naturally overwritten by real learning, and when deviation grows large the SWR guard re-tunes and heals automatically. On 2026-09-28 a full-library measured playback healthcheck (59 clusters) was run; all 20 failed parameters were repaired.

BandTypical measured parametersAnchor strengthPost-tune SWR
40mLC Ā· L=0.7–1.2 µH Ā· C=440–480 pF Anchor at 7050 kHz n=1075 (strongest) Ā· re-tuned on upper edge 9-281.0–1.2
20mCL Ā· L=0.4–0.6 µH Ā· C=110–170 pF Multiple anchors with n=80+ Ā· low edge back-filled 9-28, 1.0–1.41.0–1.2
15mLC Ā· Lā‰ˆ0–0.1 µH Ā· C=20–40 pF n=86–90Nearly a straight through (raw 1.25)
10mCL Ā· L=0.1 µH Ā· C=80–130 pF (9-28 topology-flip replay) 4 anchors re-tuned by device + 171-point interpolation1.0–1.6
80mC maxed at the 1270 pF ceiling yet only reaches 3.86 Structural wallAbandoned
Why 80 m can never be tuned below 1.5 (three structural reasons): ā‘  at 3.8 MHz the 21.9 m wire is only 0.28Ī»; the end-fed impedance is extremely low-Z and highly capacitive, measured raw SWR a flat 16.1–16.3 across the band; ā‘” matching it needs Cā‰ˆ2500–3500 pF, but the ATR-1000's capacitance ceiling is only 1270 pF — measured best full tune is 3.86; ā‘¢ even if SWR were brought down, feedline loss at SWR 16 adds 3–6 dB, half the power heating the feedline. For 80 m, put up a dedicated antenna.

Full-library measured playback on 9-28: 20 of 59 clusters had failed

The SWR values recorded in the library are history, not today's truth. Each learned parameter was played back point by point against the real antenna (seed_healthcheck), then repaired by three means: device re-tune / anchor interpolation / direct rewrite — this is the learn library's first full calibration.

RegionHealthcheck findingRepair methodMeasured SWR after repair
40 m upper edge 7160–7200Drift 2.79–3.41 Device re-tune at 7160/7200 + anchor interpolation at 7170/71901.00
Entire 10 m band Whole family failed 9.4–13.7 (topology flipped from LC to CL) 4-anchor device re-tune + least-squares fit replay of 171 points (CL L1/C8–C13) 1.00–1.61
15 m 21405 kHzMis-learned CL parameters 2.93 Rewritten LC L0/C4 (justified by measured neighbour points)1.2
20 m low-edge, 4 pointsNodata in healthcheck Back-filled; seeds confirmed healthy (measurement artefact)1.00–1.38
80 m 3855 / 40 m 7063/7110Mis-learned 2.33–15.8 Rewritten directly from adjacent measured anchors≤1.5 (nominal)
One software-level root cause caught by this healthcheck: MRRC's PTT safety watchdog (TOT=120 s hard limit) does not exempt tune mode — long auto-tuning sessions had PTT force-released at 120.9 s, and once TX dropped, the tune commands sent to the ATU were silently ignored by the device; all six tuning points of the first repair round were no-ops. The second round re-armed tune before each tuning point to reset the timer, and polled the log until "tune-confirmed learning" appeared before moving to the next frequency (learning confirmation requires relay stability >8 s; any mid-way frequency change voids it) — all succeeded.

Companion upgrade (proxy V5.9.0): after a full tune, if SWR improved versus pre-tune and ≤1.8, the device-selected final parameters are force-written into the library, no longer subject to the 3 W learning-power gate — fixing the "tuned in vain" problem where manual tune results under a weak tune carrier (~2 W) never entered the library and were overwritten by old parameters. Auto-tune trigger threshold set to SWR > 2.0 (debounced 3.5 s).

Calculator: a 🧮 frequency→L/C tuner calculator based on measured impedance anchors (5351.5 kHz Z=59+j112 Ī©, among others) is live — enter any frequency and it returns relay parameters and predicted SWR; all formula derivations are public. Note the calculator's uncertainty is ±3–5 steps; use it for seeding and topology prediction only — final values come from the device's own tune (60 m proof: computed optimum 1.46 vs device self-sweep 1.02).

The whole truth about this antenna

MetricMeasured value
Fundamental resonance f16.50 MHz (plateau 6.42–6.58)
Harmonic family2fā‰ˆ13.95 / 3fā‰ˆ21.3 / 4fā‰ˆ28.5 MHz
Physical radiator lengthā‰ˆ 21.5–21.9 m (VF 0.93–0.95)
Q at f1 / SWR≤2 bandwidthQā‰ˆ12 / 530 kHz
Wire-end resonance resistanceā‰ˆ 2200–2700 Ī© → a bulls-eye for 49:1
Best / worst band15m (1.25, no tuner needed) / 17m (12.5, anti-resonant)
Typical radiation angle9–12°
Rain detuning (7050)Ī”L +0.9 µH (Ī”Xā‰ˆ+40 Ī©, capacitive drift)
Action list: ā‘  Keep the current wire length — trimming the wire to raise f1 into 40 m would destroy 15 m's perfect plateau and the bottom edge of 20 m; not worth it; ā‘” Daily band priority: 15 m > lower half of 20 m > 40 m (with tuner) > middle of 10 m; avoid 17 m/30 m/12 m; ā‘¢ Abandon 80 m on the current system entirely; ā‘£ after rain, run a single-band sweep on your working bands against the baseline; ⑤ To do: independent NanoVNA sweep at the unun end to characterise feedline electrical length.

Data & reproducibility: raw sweep JSON lives in the mrrc repository under antenna_sweeps/, analysis scripts dev_tools/analyze_sweep.py, fit_tuner_params.py, seed_healthcheck.py (learn-library healthcheck), fix_bad_seeds2.py (bad-seed repair), the overall report docs/current/antenna/efhw-49-1-antenna-analysis-2026-09-27.md, and the full project retrospective at docs/current/antenna/efhw-atr1000-project-retrospective-2026-09-28.md. The sweep infrastructure (engine/API/frontend) is now solidified — future dry/wet environment comparisons are a one-click re-run.